Lanes: Step 4 - Comparing Data
Now that the lane and band information has been extracted from the TLC plate it
is time to investigate and compare data. In each place where a graph or data grid
is present in the control views you can alter the data comparison to fit your needs.
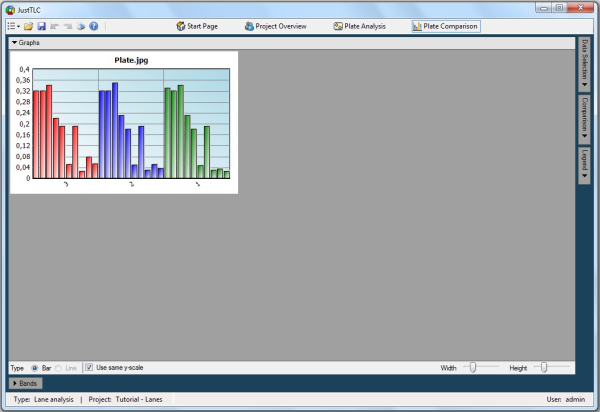
Go to the Plate Comparison ( ) control view by clicking on the Plate Comparison icon in the
toolbar. The view is displayed in the image below. ) control view by clicking on the Plate Comparison icon in the
toolbar. The view is displayed in the image below.
Open the Comparison panel by clicking on the Comparison button in
the right button bar. Change to order by Rf as illustrated in the screen
shot below. The bars in the graph will be arranged according to their respective
Rf value. This means that all bands are automatically matched with each other based
on their Rf value, making it a simple task to compare bands between lanes. These
matched bands group to form a track.
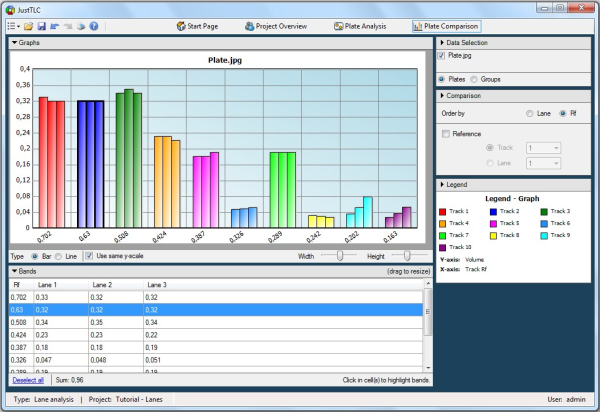
Expand the bands table by clicking on the Bands button at the bottom and
highlight the second track from the top by clicking on the Rf value in the first
column. The bands in this track all have very similar volume. By looking in the
graph it is easy to see that the two tracks with the lowest Rf values differ quite
a lot while the other tracks have stable volume across all lanes.
Lane Analysis
Spot Analysis
|