Lanes: Step 2 - Analyzing Plates
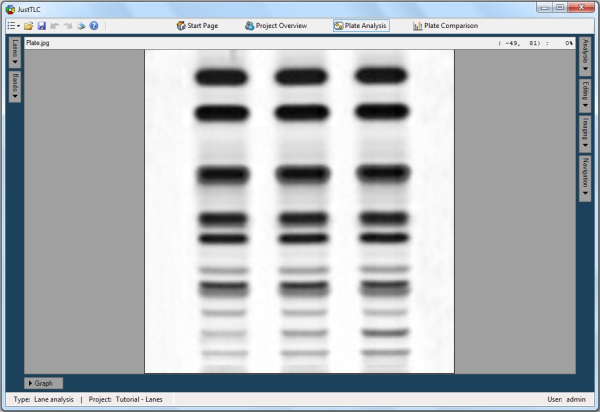
Plate analysis is done in the Plate Analysis ( ) control view. By double clicking on the plate "Plate.jpg" you will
be redirect to the view, which is shown below. ) control view. By double clicking on the plate "Plate.jpg" you will
be redirect to the view, which is shown below.
In the upper right part you will find the Analysis button. Click it and the
Analysis panel is shown. Here, you find controls that are used when automatically
analyzing your plates. Use the Noise level track bar and set the value to
1 of 10. This tells the detection and quantification algorithms how much to smooth
the image.
Continue and change the number of lanes to try to locate from 10 to 3. Click the
Detect button and the lanes will be detected in the image. Detected lanes
are marked as red polygons in the image.
Expand the lanes table by clicking on the Lanes button in the upper left
part of the window. In the table the number of detected lanes is shown in the header
and the lanes properties such as ID, width and volume are shown in the table. Select
lane two by clicking on the row in the table and note how it is highlighted in the
image. By clicking on the Graph button, located at the bottom of the screen,
the profile of the lane will be displayed.
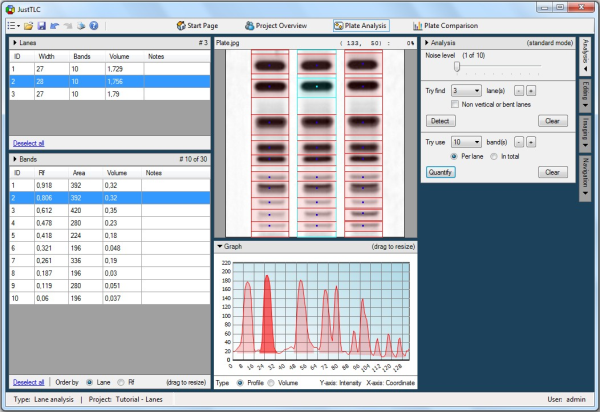
Finally, set the number of bands to try to locate to 10 and click on the Quantify
button located in the Analysis panel. Now, the lanes are quantified by detecting
present bands and they are marked as rectangles in each lane. The profile graph
is instantly updated and peaks are filled according to the quantification result.
Highlight the second band from the top in lane 2 by clicking on it in the image
and expand the bands table by clicking on the Bands button in the upper left
part of the window. Details about each band in the lane is displayed and highlighted.
You have now analyzed your first TLC plate in the project.
Lane Analysis
Spot Analysis
|